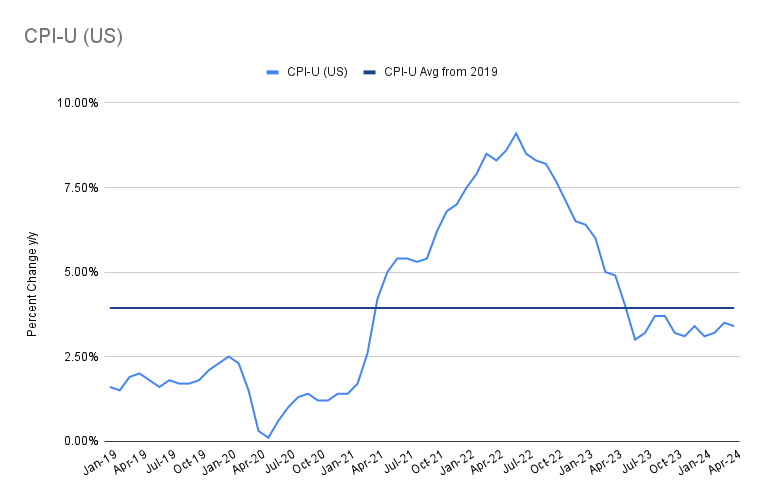
| BLS Release: The Consumer Price Index for All Urban Consumers (CPI-U) increased 0.3% in April, after rising 0.4% in March. Over the past decade, US CPI averaged 1.6% y/y. Over the past 12 months, BLS Release: The Consumer Price Index for All Urban Consumers (CPI-U) increased 0.3% in April, after rising 0.4% in March. Over the past decade, US CPI averaged 1.6% y/y. Over the past 12 months, ending April, it was +3.4%, 10 bps below March’s reading. Fed Chair Jerome Powell’s preferred inflation metric, referred to as: Core Services minus Housing and/or Core CPI Services Ex-Shelter (SuperCore), rose +0.5% m/m and up +5.05% y/y. While below last month’s +0.7% increase, any print above 4% suggests that inflation is not cooling fast enough. |
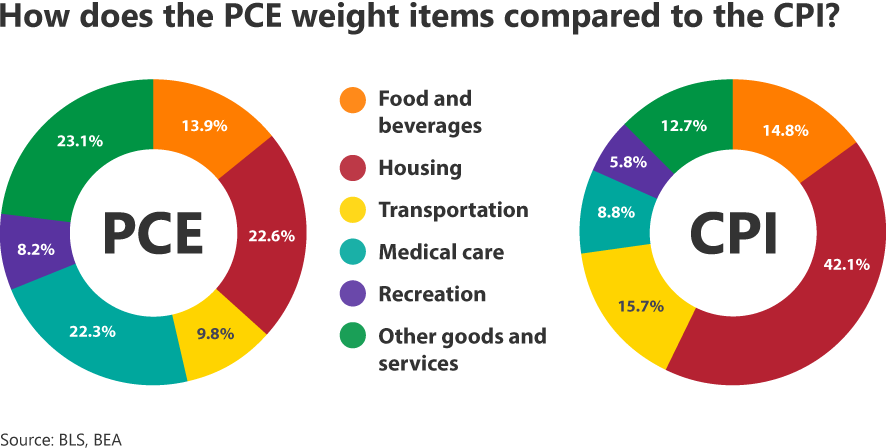
The Consumer Price Index For All Urban Consumers (CPI-U), as released by the BLS, measures the changes in the price of a basket of goods and services purchased by urban consumers. US Urban Consumers account for over 90% of the total US population. The BLS divides expenditures into eight categories and assigns a percentage relative size to the individual components within the index.
The price index for Personal Consumption Expenditures (or PCE Price Index) is another measure of inflation. The PCE price index measures the change in prices for all consumption items, not just those paid for out-of-pocket by consumers.
Over the past decade, US CPI averaged 1.6% y/y. Over the past 12 months, ending April, it was +3.4%.
Fed Chair Jerome Powell’s preferred inflation metric, referred to as:
Core Services minus Housing and/or Core CPI Services Ex-Shelter (SuperCore), rose +0.5% m/m or +5.05% y/y.
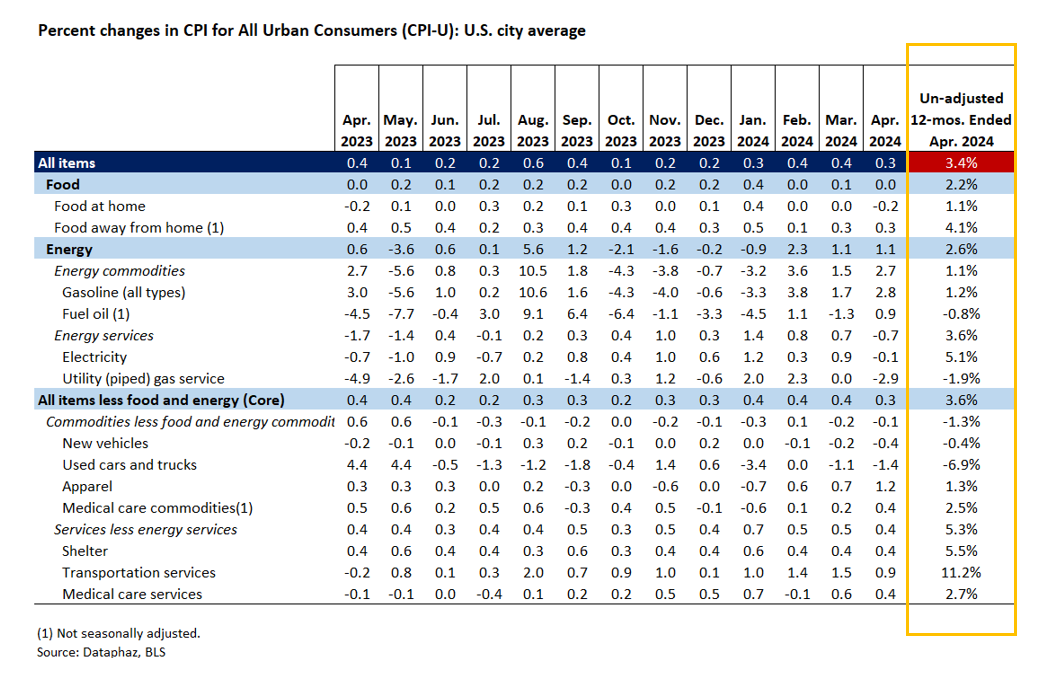
Shelter Index rose +5.5% y/y or +0.4% m/m. The Rent Index rose +0.4% or +5.4% y/y with Index for Owners’ Equivalent Rent increasing +0.4% over-the-month or +5.8% y/y.
Food Index remained unchanged at +3.4% y/y or +0.3% m/m with the food at home index declined -0.2% m/m while the food away from home index rose +0.3% over-the-month or +4.1% y/y, down 10 bps from March’s reading.
Energy Index increased 50 bps from March, increasing to +2.6% over-the-year and +1.1% over-the-month. Gasoline Index increased +2.8% m/m with the Fuel Oil Index increasing +0.9% over-the-month. The index for electricity decreased (-0.1%) over-the-month and the Index for Natural Gas decreased (-1.9%) y/y and (-2.9%) over-the-month..
All Items Index decreased 10 bps from March to April’s +3.4% y/y reading.
Index for All Items Less Food and Energy (CPI Core) rose +0.3% m/m or +3.6% over-the-year.
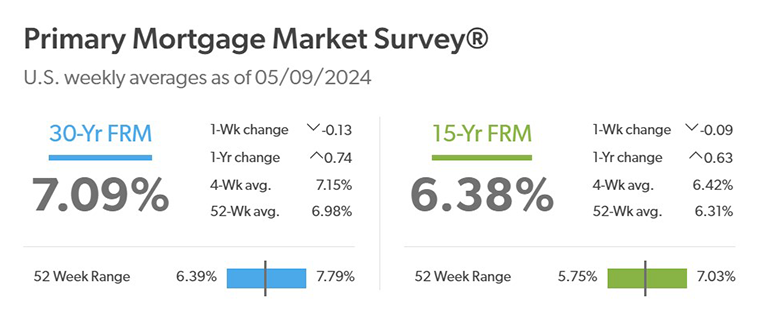
| The US 10-Year is now 4.327%, having retreated 38 bps from April 25’s high of 4.708%. Freddie Mac’s Primary Market Survey (PMMS) saw mortgage rates rise with the 30-Yr FRM increasing +74 bps y/y to 7.09%. Yield Curve inversion continued its historic run with the 2s10s spread having now been inverted over 625 days, the longest in history. From FreddieMac: After a five week climb, mortgage rates ticked down following a weaker than expected jobs report. An environment where rates continue to hover above seven percent impacts both sellers and buyers. Many potential sellers remain hesitant to list their home and part with lower mortgage rates from years prior, adversely impacting supply and keeping house prices elevated. These elevated house prices add to the overall affordability challenges that potential buyers face in this high-rate environment. |
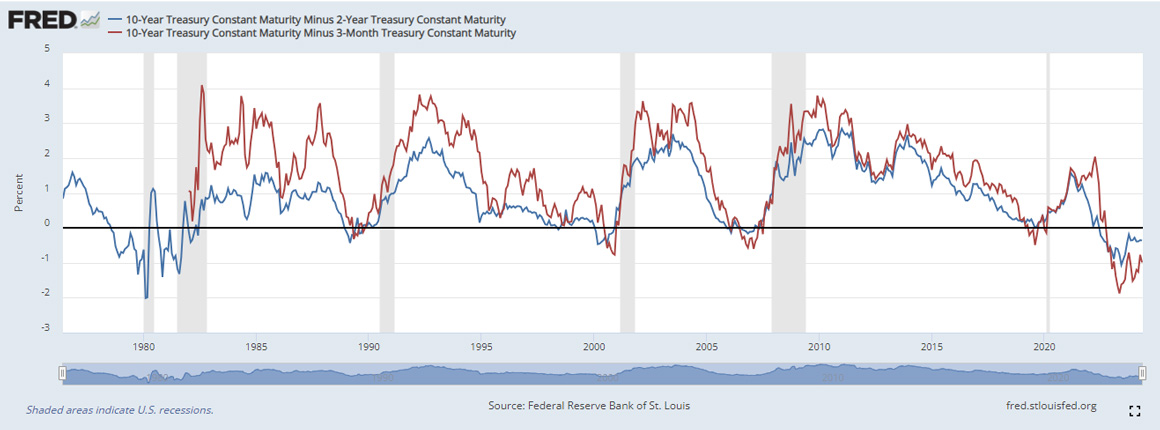
Yield Curve
When a shorter-term instrument yields a higher rate of return (RoR) than a longer-term instrument, it is referred to as an inverted spread. Since July 2022, the yield curve has been inverted as concerns over the economy mount, with Q1’24 GDP data coming in at +1.6%, well below the +2.4% estimate, the Federal Reserve’s fastest monetary tightening cycle since the 1980s and persistent inflation.
10Y minus 2Y (Blue Line)
Over the last 70 years all US recessions occurred after the 10Y minus 2Y inverted. The 2s10s spread (FRED T10Y2Y) has now been inverted for over 625 days, surpassing the 1978-1980 inversion of 624 days for the longest ever.
10Y minus 3-Month (Red Line)
Has been inverted since late October 2022 and the longest inversion since 1962.
| The Federal Open Market Committee’s (FOMC) meeting was held April 30-May 1, 2024 and was the sixth consecutive meeting for “temporary pause” in hikes and kept its benchmark rate to a target range of 5.25%- 5.5%. In a surprise move, beginning June 1st the Fed announced it will slow the pace of its Quantitative Tightening (QT); to $25B per month from $60B. |
| While the next Dot Plot release is scheduled for June, March’s Dot Plot maintained the Fed’s dovish policy with the median dot showing a median rate of 4.6% by the end of 2024. Meanwhile the median forecast rate for 2025 edged higher, +30bps, to 3.9%, from the previously expected 3.6%. |
| “There’s a thousand things that could go wrong tomorrow, but right now everything is in pretty good shape.” -Brian Moynihan, CEO, Bank of America |
You must be logged in to post a comment.